City of Fridley | 2024 Performance Measures Report
 In 2019, the City of Fridley (City), under general direction of the City Manager, formed the Process Management Team to improve the efficacy of City programs in services. In 2024, the City restructured this team as the Project Management Team (PMT) to enhance the ability of the City to resolve complex administrative and service delivery challenges and create a performance measurement program.
To measure the success and efficacy of key City processes, the PMT facilitates the City's participation in the Minnesota Local Performance Measurement Program (Program) offered by the Office of the State Auditor (OSA) in conjunction with Council on Local Results and Innovation.
By formally reporting on at least 10 of the 29 performance measures identified by the Program to the OSA, the City may receive two benefits:
- A per capita reimbursement of $0.14
- An exemption from property tax levy limit if they are in effect
To participate in the Program, the City Council must adopt the minimum number of performance measures, report them at least annual to residents and submit a document detailing the actual results.
Within the report, there is a full overview of the elected performance measures data as well as individual data sets and descriptions of the measurements. Descriptions include what data is being measured, why the data is important and what the results mean for the City of Fridley.
On June 9, 2025, the Fridley City Council adopted a resolution authorizing the PMT to submit the 2024 Performance Measurement Report to the Office of the State Auditor.
PMT Members
- Melissa Moore, City Manager's Office
- Olivia Gnadke, City Manager's Office - Communications
- Jordynn Poferl, Community Development - Planning
- Brian Ahler, Public Works - Streets
- Malek Elbatta, Public Works - Engineering
- Patrick Faber, Public Safety - Police
- James Lang, Public Safety - Fire
For the Year Ended December 31, 2024
| General |
2020 |
2021 |
2022 |
2023 |
2024 |
| Percentage change in Taxable Market Value |
12.08% |
6.29% |
5.84% |
7.70% |
3.17% |
| Nuisance code enforcement cases per 1,000 population |
33.86 |
35.18 |
28.63 |
24.86 |
24.72 |
| Bond rating |
Aaa |
Aaa |
Aa2 |
Aa2 |
Aa2 |
| Accuracy of post-election audit |
Not selected for audit
|
Not selected for audit |
100% |
Not selected for audit |
100% |
| Police Services |
2020 |
2021 |
2022 |
2023 |
2024 |
| Part I Crime Rates |
1,329 |
1,312 |
1,400 |
1,076 |
1,013 |
| Part II Crime Rates |
1,007 |
842 |
796 |
662 |
709 |
| Part I Crime Clearance Rates |
24% |
32% |
31% |
29% |
41% |
| Part II Crime Clearance Rates |
42% |
50% |
48% |
50% |
54% |
| Average Police Response Time |
3:53 Minutes |
5:39 Minutes |
5:39 Minutes |
5:36 Minutes |
5:07 Minutes |
| Fire & EMS Services |
2020 |
2021 |
2022 |
2023 |
2024 |
| Insurance industry rating of fire services |
Class 3 |
Class 3 |
Class 3 |
Class 3 |
Class 3 |
| Average fire response time |
6:07 Minutes |
6:07 Minutes |
5:38 Minutes |
5:48 Minutes |
6:06 Minutes |
| Fire calls per 1,000 population |
114 |
102 |
111 |
107 |
99 |
| Number of fires with losses resulting in investigation |
39 |
40 |
31 |
12 |
23 |
| Public Works - Streets |
2020 |
2021 |
2022 |
2023 |
2024 |
| Average city street pavement condition rating |
6.84 |
6.80 |
6.87 |
6.70 |
6.76 |
| Expenditures for road rehabilitation per paved lane mile rehabilitated |
$213,794 |
$210,025 |
$121,700 |
$219,405 |
$256,520 |
| Percentage of all jurisdiction lane miles rehabilitated in a year |
3.15% |
2.60% |
1.58% |
2.77% |
1.03% |
| Average hours to complete road system during snow event |
7.39 Hours |
2.25 Hours |
7.25 Hours |
6.37 Hours |
6.6 Hours |
| Public Works - Water |
2020 |
2021 |
2022 |
2023 |
2024 |
| Operating cost per one million gallons of water pumped/produced |
$1,868 |
$1,886 |
$1,987 |
$2,004 |
$2,282 |
| Sanitary Sewer |
2020 |
2021 |
2022 |
2023 |
2024 |
| Number of sewer blockages on city system per 100 connections |
.036 |
.012 |
.071 |
.071 |
0.05 |
Percent Change in the Taxable Market Value
| Taxable Property Market Value |
2020 |
2021 |
2022 |
2023 |
2024 |
| Percentage change |
12.08% |
6.29% |
5.84% |
7.70% |
3.17% |
| Taxable Market Value |
$3,049,186,337 |
$3,240,926,104 |
$3,977,804,222 |
$4,284,085,399 |
$4,420,032,000 |
Source: Anoka County and City Assessing Division
What does the data tell us?
 The taxable market value has declined slightly at $4,297.056,919 versus last year's $4,420,032,00 which is a 2.86% drop.
The residential real estate market in Fridley looked a lot like the prior year, 2023. The median sale price remained unchanged at $315,000 while the average sale price increased from $311,800 to $318,400. Sales volume was down almost 11% but is trending upward in the first quarter of 2025. Inventory of homes for sale is rising while mortgage interest rates are fluctuating around 6.75%. Warehouse properties continue to garner modest price growth while most other industrial property types are holding steady or in some cases, losing value. Commercial properties, especially office, are struggling to return to pre-pandemic prices. Apartment buildings have also given back some of the substantial gains achieved when interest rates were half of the prevailing rates today. The net effect of these changes is to shift some of the property tax burden back towards residential property owners.
What is it?
As a local taxing jurisdiction, property taxes are the principal funding source for the City and its operations. For some real property, a portion of its market value may be excluded from taxation, such as the homestead Market Value Exclusion. Once a taxing jurisdiction applies those exclusions, the market value becomes the Taxable Market Value (TMV).
Why does it matter?
The City uses the TMV to help determine the tax liability for each property within its jurisdiction. Usually, when the TMV for the City increases, the property tax rate decreases, and a property pays less in City property taxes. In other words, when the City grows there are more properties to pay taxes, and they can all pay a little less.
Nuisance Code Enforcement Cases (Per 1,000 Residents)
| Nuisance Code Enforcement Cases |
2020 |
2021 |
2022 |
2023 |
2024 |
| Cases per year |
992 |
1,041 |
868 |
753 |
748 |
| Population per year |
29,300 |
29,590 |
30,313 |
30,289 |
30,258 |
| Cases per 1,000 residents |
33.86 |
35.18 |
28.63 |
24.86 |
24.72 |
What does the data tell us?
 Nuisance code enforcement cases reflect the City's commitment to enforcing the City Code through the work of code enforcement staff. This work is important in helping to preserve a vibrant community and maintain property values. Since coming out of the COVID-19 pandemic, the case load continues to remain consistent over the last three years. A focus on educating the residents regarding the codes the City enforces will help to keep these numbers stable.
What is it?
The City must preserve and protect the general welfare of its residents, including the abatement and prevention of public nuisances. Minnesota Statute §561.01 states "Anything which is injurious to health, or indecent or offensive to the senses, or an obstruction to the free use of property, so as to interfere with the comfortable enjoyment of life or property, is a nuisance."
Why does it matter?
Public nuisance ordinances are designed to preserve the peace, quality of life and public health of the community. The Fridley City Code regulates a number of activities to prevent the creation of public nuisance, including compost, garbage and yard waste storage, exterior storage, fences, housing and lawn maintenance, home occupations, noise, vehicle parking, vehicle sale, vehicle storage and vision safety. These efforts make the City a safe, vibrant, friendly and stable home for families and businesses.
Bond Rating
| Moody Bond Rating |
2020 |
2021 |
2022 |
2023 |
2024 |
| Rating |
Aaa |
Aaa |
Aa2 |
Aa2 |
Aa2 |
What does the data tell us?
The City maintains an Aa2, or the third highest, bond rating from Moody's. The most recent bond rating (2024) notes the healthy financial reserves, stable operations and strong redevelopment activities.
What is it?
On occasion, the City issues debt, known as bonds, to support capital improvements (e.g., road rehabilitation). The process tends to be similar to a mortgage used for a home – a financial institution lends money to the City and the City agrees to repay it with interest over many years. To verify the City’s ability to make those payments, it receives a bond rating from an independent agency, Moody’s Investor Services (Moody’s). The agency evaluates the City on several factors, such as economic stability, management practices and financial performance.
Why does it matter?
A bond rating may be thought of as a measure of risk or the likelihood that the City would not be able to make debt service payment, also known as default. Therefore, a financial institution uses the bond rating to determine the cost to the City to borrow money – expressed as a higher or lower interest rate. The higher the bond rating, the lower the interest rate and vice versa. In some situations, a lower bond rating (higher interest rate) could cost hundreds of thousands of dollars in additional interest costs.
Accuracy of Post-Election Audit Results
| Election Cycle |
2020 |
2021 |
2022 |
2023 |
2024 |
| Accuracy of post-election elected |
Not Selected for Audit |
Not Selected for Audit |
100% |
Not Selected for Audit |
100% |
What does the data tell us?
The City had not been selected for audit for serval years. In 2022 the Anoka County Canvasing Board randomly selected Ward 2 Precinct 1 for a post-election audit. Ballots were hand counted by Election Judges for Governor, United States Representative and Secretary of State. Results of the hand count matched the results reported by the City's vote counting equipment from Election Day. The City conducted no elections in 2023. In 2024 the City was again randomly selected for a post-election audit for Ward 2, Precinct 3. Ballots were hand counted for President and United States Representative and was completed with 100% accuracy.
What is it?
According to the Office of the Secretary of State, “Minnesota Statute § 206.89 states that after every state general election, Minnesota counties perform a post–election review of election results returned by the optical scan ballot counters used in the state. The review is a hand count of the ballots for each eligible election (US President, US Senator, US Representative and Governor) in the selected precincts compared with the results from the voting system used in those precincts.”
For Anoka County (County), the County Canvassing Board must conduct a review of at least four precincts, or 3% of the total number of precincts in the County, whichever is greater. The precincts must be selected randomly.
Why does it matter?
Post–election audits allow the City, other levels of government and the public to verify election results, deter voter fraud, discover errors and promote confidence in the election(s) process. In turn, the review helps the City improve internal processes and service delivery.
Part I and Part II Crime Rates
| |
2020 |
2021 |
2022 |
2023 |
2024 |
| Part I Crime |
1,329 |
1,312 |
1,400 |
1,076 |
1,013 |
| Part II Crime |
1,007 |
842 |
796 |
662 |
709 |
| Total |
2,336 |
2,154 |
2,196 |
1,738 |
1,722 |

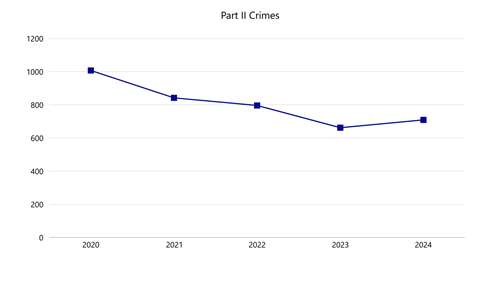
What does the data tell us?
The Police Division responded to 33,172 calls for service in 2024, which is a decrease of 13.94% from 38,545 in 2023. Although nominally dropping, crime parts stayed relative, which is consistent with the national crime trends.
Part I crimes consist of more serious crimes such as homicide, robbery and assault. However, are slightly misleading as they also contain larceny, which is all manner of theft. Part II crimes are lesser severe acts such as narcotics, intoxicated driving and disorderly conducts.
What is it?
Crimes committed by perpetrators are classified as either Part I or Part II crimes. Part I crimes include homicide, sexual assault, robbery, aggravated assault, burglary, larceny-theft (shoplifting or pickpockets), motor vehicle theft and arson. Part II crimes include other assaults, forgery and counterfeiting, fraud, embezzlement, stolen property (buying, receiving or possessing), prostitution, sex offenses, drug abuse violations, offenses against family and children, driving under the influence, drunkenness, disorderly conduct and all other offenses.
Why does it matter?
This data reported by the Department of Public Safety reflects the City's commitment to promoting public safety. Partnering with the community through engagement, leadership and education, assists in keeping Part I and Part II crime rates low.
Part I and Part II Clearance Rates
| |
2020 |
2021 |
2022 |
2023 |
2024 |
| Part I Clearance Rate (%) |
24% |
32% |
31% |
29% |
41% |
| Part II Clearance Rate (%) |
42% |
50% |
48% |
50% |
54% |


What does the data tell us?
Evaluating the rate at which Part I and Part II crimes are cleared is often used as a measure of effectiveness in solving crimes. The crime part clearance rates reflect the number of crimes that were "cleared." This does not reflect the total amounts of arrest by an agency, however, it does indicate how many cases the agency was able to investigate and refer to prosecution. Fridley's clearance rate is higher than the national average of 37%.
What is it?
Clearance rates measure the number of calls for service involving Part I and Part II crimes leading to various resolutions including warning, citations or even arrests. The clearance rate is calculated by dividing the number of crimes that are cleared by the total number of crimes recorded.
Why does it matter?
The Police Division promotes the safety of the community and the feeling of security through the maintenance of law and order. This includes following through and applying legal penalties for violations.
Average Police Response Time
| |
2020 |
2021 |
2022 |
2023 |
2024 |
| Average Police Response Time |
3:53 minutes |
5:39 minutes |
5:39 minutes |
5:36 minutes |
5:07 minutes |
What does the data tell us?
 The average police response time is an average of all officers in the agency and how long it took from the time an officer was dispatched to a call to the time when the first officer arrives. Many factors play into this metric including new officers learning the City's geography, to lower-priority phone call reports that may have significant delays due to officers handling priority, in-progress calls first. Overall, 5:07 is a well-accepted response time in the industry for a geography, population, and patrol shift strength in Fridley.
What is it?
The average police response time details calls for service through the Anoka County Dispatch Center. The times do not reflect calls for service initiated by staff in the field. The measurement analyzes the amount of time from when an officer was sent on a call, to when the officer indicated they arrived on scene.
Why does it matter?
The Police Division promotes the safety of the community and the feeling of security through the maintenance of law and order, crime prevention, timely response to requests for police service and positive contacts with the public.
Insurance Industry Rating of Fire Services (Rating/Every Five Years)
| |
2020 |
2021 |
2022 |
2023 |
2024 |
| Insurance Industry Rating of Fire Services |
Class 3 |
Class 3 |
Class 3 |
Class 3 |
Class 3 |
What does the data tell us?
The Fie Division has been able to maintain an Insurance Services Office (ISO) rating of Class 3 consistently over the years, according to the Public Protection Classification Summary Report (PPC). The results are based on emergency communication, fire department equipment and operations, city water supply and community risk reduction surveys. This rating is typical of a city the size of Fridley.
What is it?
A company called Insurance Services Office (ISO) creates ratings for fire departments and their surrounding communities. An ISO fire insurance rating, also referred to as a fire score or Public Protection Classification (PPC), is a score from one to 10 (one is the best, 10 is the worst) that indicates how well-protected your community is by the fire service. Insurers then use it to help set business and homeowner insurance rates. The more well-equipped a fire service is to put out a fire, the less likely houses will be lost to a structure fire. There is less risk to the home, and therefore it is less expensive to ensure.
Why does it matter?
In order to maintain a good ISO rating, a city must demonstrate their ability to provide fire protection through many different areas, such as the ability to deliver a minimum amount of water to a fire through well-maintained fire hydrants, having fire engines that deliver a minimum amount of water in gallons per minute (GPM), maintaining enough fire engines for the city's size, and staffing fire stations with the minimum amount of trained firefighters.
Fire Calls per 1,000 Population
| |
2020 |
2021 |
2022 |
2023 |
2024 |
| Fire Calls per 1,000 Population |
114 |
102 |
111 |
107 |
99 |
What does the data tell us?
 In 2020, the Fire Division began responding to medical calls related to the pandemic, which speaks to that year's increase. 2021-2024 numbers demonstrate the City's new average calls for service for a slightly increasing population.
What is it?
The Fire Division responded to 2,984 emergency calls in 2022. Based on the number of calls and total residents, there were 99 emergency responses per 1,000 Fridley residents.
Why does it matter?
The Fire Division projects an increase of more than 14% in emergency response calls over the next few years. This is based on the planned future residential housing and multi-story developments that lead to an estimated increase of 4,000 residents. The increase will determine future growth, staffing, equipment and supply needs of the division.
Average Fire Response Time
| |
2020 |
2021 |
2022 |
2023 |
2024 |
| Average fire response time |
6:07 Minutes |
6:07 Minutes |
5:38 Minutes |
5:48 Minutes |
6:06 Minutes |
What does the data tell us?
 Response time is made up of three components. First is call taking by dispatch - the amount of time it takes to dispatch to field the call and direct a response. Second is turnout time - the amount of time from when the call is dispatched to when the fire truck leaves the station. Third is travel time - the amount of time it takes for the vehicle to travel to the incident, which can vary based on distance and time of day.
What is it?
When fire services analyze their response times, they are really analyzing seconds in time. For example, the National Fire Protection Association (NFPA) 1710 standard states "The fire department's fire suppression resources shall be deployed to provide for the arrival of an engine company within a 240-second travel time (four minutes) to 90% of the incidents." That means every second counts, including answering time (15 seconds), call processing time (60 seconds), and turnout time (80 seconds). For the City's paid-on-call firefighters, response time from home is approximately 6-10 minutes.
Why does it matter?
When measuring the effectiveness of fire protection services, response times are the key indicator. It determines if more resources are needed to effectively serve and protect communities. Therefore, it is crucial that local governments take these statistics seriously and allocate resources according to the specific needs of their local fire departments.
Number of Fires Resulting in Investigation and Financial Loss
| |
2020 |
2021 |
2022 |
2023 |
2024 |
| Number of fires with loss resulting in investigation |
39 |
40 |
31 |
12 |
23 |
What does the data tell us?
 The data represents a continued decreasing trend of fires resulting in a financial loss. This is due to a number of factors including increased staffing in the Fire Division, an increase in community outreach and fire prevention messaging, redevelopment within the City and a heavy emphasis on fire and life safety inspections across the City. In 2023 none of the incidents involving financial loss were commercial or industrial properties, which is indicative of the City's strategic emphasis on fire and life safety inspections in those occupancies.
What is it?
U.S. fire departments have reported an estimated 358,500 residential home fires each year. On average, there were about 2,695 deaths, 12,000 injuries and property damage averaging $7 billion throughout the U.S. per year. Residential home fires usually start from open flames, accidents and cooking, among other causes.
Why does it matter?
Documenting fires that resulted in investigation and financial losses as a result of the fires is a crucial tool in decision-making and helping to reduce loss to life/property due to fires. Estimating financial loss and property value are important pieces of data when assessing fire response at local, state and national levels.
Average City Street Pavement Condition Rating
| |
2020 |
2021 |
2022 |
2023 |
2024 |
| Average city street pavement condition rating |
8.84 |
6.80 |
6.87 |
6.70 |
6.76 |
 What does the data tell us?
The ratings are used to determine whether the City's road maintenance and rehabilitation strategies are satisfactory, and if there is a change in pavement quality, which may indicate that a higher or lower investment in pavement preservation is optimal. The rating remained level in 2024 due to the offset of degradation through improvements and repairs made.
What is it?
Public Works employees inspect City streets each year. Each street is given a rating on the Pavement Surface Evaluation and Rating (PASER) scale based on cracks, utility cuts and imperfections on the roadway. On the scale, zero is the worst and 10 is the best.
Why does it matter?
Regular roadway minor maintenance methods such as roadway and crack sealing and micro surfacing are cost-effective approaches to maintaining pavement in relatively good condition. if a roadway has too low of a rating, minor maintenance is ineffective, and it will need to be reconstructed entirely - which is much more expensive. Continued maintenance helps slow the aging of pavement. However, once the pavement is 50-60 years old, too much minor maintenance is needed, and a full rehabilitation is often the most efficient method of maintaining pavement quality.
Expenditures for Road Rehabilitation per Paved Line Mile Rehabilitated
| |
2020 |
2021 |
2022 |
2023 |
2024 |
| Expenditures for Road Rehabilitation per Paved Line Mile Rehabilitation |
$213,794 |
$210,025 |
$212,700 |
$219,405 |
$256,520 |
What does the data tell us?
 The data tells the City the cost and cost-effectiveness of rehabilitation projects. In recent years, the streets selected for major rehabilitation required extensive repair due to their condition and more extensive repair, along with street width, and cost of construction are the main drivers. The 2024 project increase was driven primarily by increased cost of labor and materials for construction.
What is it?
This data is measuring the cost per mile for major reconstruction of roadways. The amount it influenced by the roadway characteristics and the length of roadway segments completed in a given year.
Why does it matter?
This data shows how cost-effective the rehabilitation methods are, illustrates increases in cost of construction, and if improvements need to be made in the manner in which roads are reconstructed. This number also reflects the numerous factors influencing the complexity of construction and rehabilitation of roadways.
Percentage of All Jurisdiction Lane Miles Rehabilitated in the Year
| |
2020 |
2021 |
2022 |
2023 |
2024 |
| Percentage of all jurisdiction lane miles rehabilitated in the year |
3.15% |
2.60% |
1.58% |
2.77% |
1.03% |
What does the data tell us?
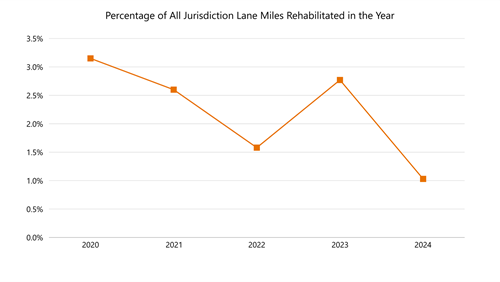
The data shows the number of miles of streets rehabilitated annually. This is related to project delivery factors such as available funding, geography of neighborhoods, roadway classification, and extent of repairs needed. 2024 mileage was under the City's target of 2% due to lack of significant grant (Federal and State) funding received to aid in the completion of increased mileage.
What is it?
The data reflects how many lane miles out of the total miles within the City are being rehabilitated every year. The goal is to average 2% per year.
Why does it matter?
If mileage is lower and streets are not being rehabilitated the average age of the pavement gets older and the quality of streets are reduced. To provide for a stable budget and yet be cost-effective and provide the best service to residents via streets, the number of miles rehabilitated should be relatively consistent each year and meet the percentage goal on average.
Average Hours to Complete Road System During Snow Event
| |
2020 |
2021 |
2022 |
2023 |
2024 |
| Average hours to complete road system during snow event |
7.39 Hours |
7.25 Hours |
7.25 Hours |
6.37 Hours |
6.60 Hours |
What does the data tell us?
 The data is an indicator of how efficient the plow routes/drivers are and the level of customer service the City is delivering to the residents. Data in a given year also indicates quantity and frequency of snow events, type of snow (light/heavy), ice conditions and timing and duration of snowfall. Data can vary year-over-year depending on how many snowfalls occurred and conditions at the time of snowfall.
What is it?
The amount of time, in hours, it takes for City plows to clear City streets. The Public Works department clears 87 miles of streets, 29 miles of trails and 12 miles of sidewalks. In total, the City clears 180 street lane miles. Street lane miles account for both sides of the roadway being cleared.
Why does it matter?
Winter road safety is extremely important to the community. Average hours of a plow route affect ability and safety of travel, which can influence work commutes, reduce school closures, keep businesses open and the ability to use recreation amenities.
Operating Cost per 1 million Gallons of Water Pumped/Produced
| |
2020 |
2021 |
2022 |
2023 |
2024 |
| Operating cost per one million gallons of water pumped/produced |
$1,868 |
$1,868 |
$1,987 |
$2,004 |
$2,282 |
What does the data tell us?
 Year-over year, the cost to produce/pump a gallon of water has increased slightly. These increases are a result of higher chemical cost, utility rates and increased consumer conservation. Customers are conserving water, which leads to an increase in operating cost for a given volume of drinking water treated and delivered.
What is it?
The treatment, storage and distribution operating costs for every million gallons of drinking water produced and delivered. The cost includes labor, supplies, maintenance, equipment and repairs, among other items.
Why does it matter?
The data is illustrative of the decline in water use due to effective conservation methods. The data also reflects increased costs of water treatment due to improved regulations and annual inflation costs of supplies, labor and equipment.
Number of Sewer Blockages on City System per 100 Connections
| |
2020 |
2021 |
2022 |
2023 |
2024 |
| Number of sewer blockages on City system per 100 connections |
0.036 |
0.012 |
0.071 |
0.071 |
0.05 |
What does the data tell us?
The data shows how effectively the Sanitary Sewer Division is cleaning and maintaining sewer mains on a regular basis. The city’s goal is to meet recommended cleaning standards of all mains in a two-year to five-year cycle. The city continues to meet or exceed this standard by cleaning the entire system every 1 to 1.5 years. The increases in 2022 and 2023 were a result of increased use of flushable wipes by residents that can clog the sewer system.
What is it?
The amount of times that Public Works responds to an emergency sewer main blockage per 100 connections in a year. Blockages can be caused by improper disposal of non-flushable materials including grease and non-flushable wipes, tree root intrusion into sewers and lack of coordination of service cleaning by contractors.
Why does it matter?
Frequency of blockages is very low and demonstrates the City's effective maintenance program for cleaning the sewer mains. The program reduces incidents of sewage backups that impact customers. When a blockage affecting a home does occur, residents are encouraged to contact the City to have the Public Works Department check to verify whether there is a blockage in the main or sewer service. This may save the resident from having to pay a contractor to clean the service.